Case studyThe application scenario consists of a WSAN deployed on a railway bridge (referred to simply as the bridge WSAN for the rest of the chapter) and sink nodes deployed on the trains, passing through, which will collect the information sensed by the bridge WSAN. This WSAN gathers important data about the structural health of the infrastructure such as vibrations and strain. An optional WSAN could also be deployed inside the train to monitor abnormal situations as the train travels over the railway bridge or for the whole itinerary (train WSAN). This information (vibration, temperature, material deformation,. . . ) on the carriages’ health can be tracked to detect problems in the train.
In the bridge WSAN a set of different nodes are deployed along the railway infrastructure. Note that nodes are not only deployed on the railway tracks but also inside the structure itself so infrastructure aging and possible incidents can be detected. The goal of the network is to self organize, to sense data whenever a train passes by and to use the next train as a data mule to upload the sensed data.
The first application prototype was developed with a single WSAN that contained all the sensor nodes in the bridge. The tests carried out in this application prototype showed disappointing results in terms of reliability. In this first approach, a single node acts as head node of the network and collects the information that is sent by the rest of nodes. Since the reliability is significantly affected by the distance between source and destination and by neighborhood traffic, in this scenario where a single WSAN contains all nodes, collisions are frequent. As a result, reliability was shown to be around 70%-80% in our preliminary tests.
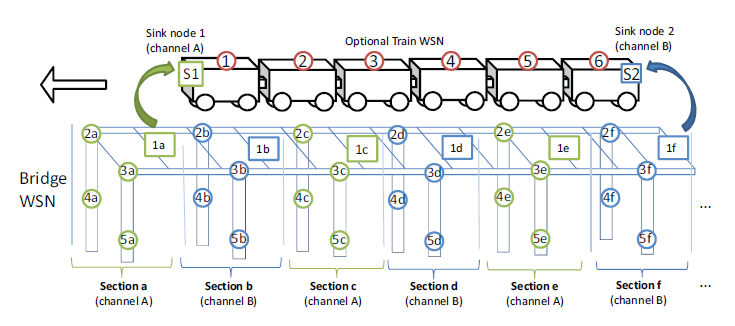
In order to increase performance, clustering techniques need to be used. Nodes along the bridge are divided into independent sections (labeled as Sections a, b, c,...). Consecutive sections operate on different channels, namely channel A and B, so there is no interference between them. In our prototype only two channels have been used, but a greater number of channels could be used if a higher throughput is desired in the data muling process. The use of separate sections reduces the maximum distance between nodes and the network traffic thereby improving network energy consumption and reliability.
The application scenario consists of a WSAN deployed on a railway bridge (referred to simply as the bridge WSAN for the rest of the chapter) and sink nodes deployed on the trains, passing through, which will collect the information sensed by the bridge WSAN. This WSAN gathers important data about the structural health of the infrastructure such as vibrations and strain. An optional WSAN could also be deployed inside the train to monitor abnormal situations as the train travels over the railway bridge or for the whole itinerary (train WSAN). This information (vibration, temperature, material deformation,. . . ) on the carriages’ health can be tracked to detect problems in the train.
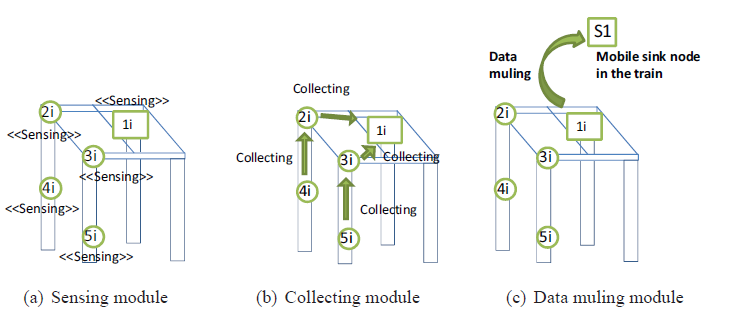
In the case study prototype, each section is composed of a total of 5 nodes. All these nodes (including the head node) participate in sensing data but only the head node communicates with the train to upload the sensed data. This organization of the section (tree-based) has been chosen because it minimizes neighborhood interference and therefore improves the reliability of each section. Application developers are not directly aware of the routing protocol, nor the network organization, that is, the middleware automatically delivers the information. This allows them to add or remove nodes from each section on-the-fly, even in other topologies distinct from the tree one used in this prototype. The sensed information collected in the head nodes is stored until the next train passes by. In that moment, the data muling protocol will start uploading the information to the train.
Evaluation The complete case study application has been implemented with the settings described. The results in terms of reliability and quantity of data generated by the WSAN have been analyzed.
The total amount of sensed data has been received by each head node which gives a reliability of 100% because the PS-QUASAR has been configured to use reliable communications. The data muling transfer rate from the bridge WSAN to nodes S1 and S2 for each train is 0.668 Kbps and 0.665 Kbps. That means that the mean data muling transfer rate for the whole system is 1.334 Kbps. Although in the application scenario all packets have been successfully transferred to the train the data muling transfer rate is really low compared to the maximum data rate of the mote (around 45 Kbps).
Several factors may have influenced this data rate drop. First, the head node also carries out the sensing task at a rate of 2Hz which slows down the data muling process. Head nodes can be programmed not to carry out sensing if a higher data rate is needed in the head nodes. Also, the operating system and the retransmission mechanism introduces some latency, especially when ACKs have not been received (the radio has to wait a predefined time if no ACK has been received before sending a retransmission). Finally, the radio range of the head nodes is assumed to be relatively short (i.e. 50 metres if the train moves at a speed of 100 Km/h). By extending the radio range of head nodes the data muling transfer rate can be easily increased. Power consumption during the data collection is relatively low, 1.950 mW and 1.832 for head nodes and normal nodes, respectively. Power consumption of the sink nodes is also low, although energy consumption in sink nodes is not a concern because they can be powered as they are located on the train. During the sensing and data muling processes, head nodes have the highest energy consumption since all the information gathered by the network needs to be transmitted by them. However, this only happens when trains are crossing the bridge which constitutes a really short amount of time compared to the amount of time the head nodes are collecting information.
More details about the architecture and test settings of this case study can be found here.